
Saved charts - edit and save views
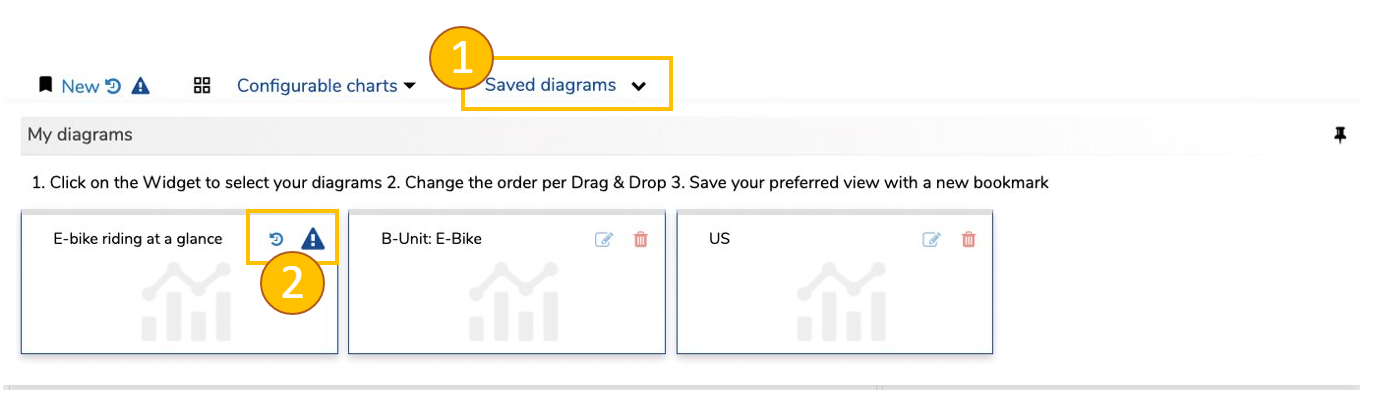
Under "Saved diagrams" (1) you can see all of your dashboard charts. In the case of newly created charts or changes (via the Wizard menu) to existing charts, you will see the symbols for "Discard" and "Save changes" in blue on the top right of the respective tile  (2).
(2).
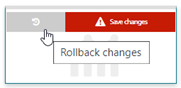
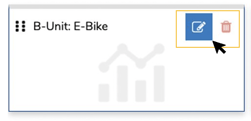
You can execute the corresponding option by mouseover over the tile.
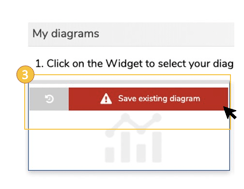
To save a chart, click on "Save existing diagram" (3).
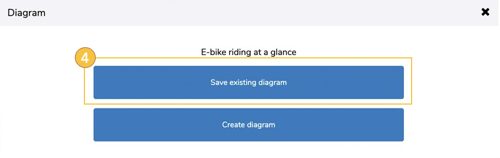
The "Save chart" popup opens. Here you can either create diagram or save the chart here and click on "Save existing diagram" (4).
The changes are immediately visible in the dashboard.
To edit the chart, click on the pencil symbol  . To delete the diagram, click the garbage can icon
  .
.
Manage saved charts
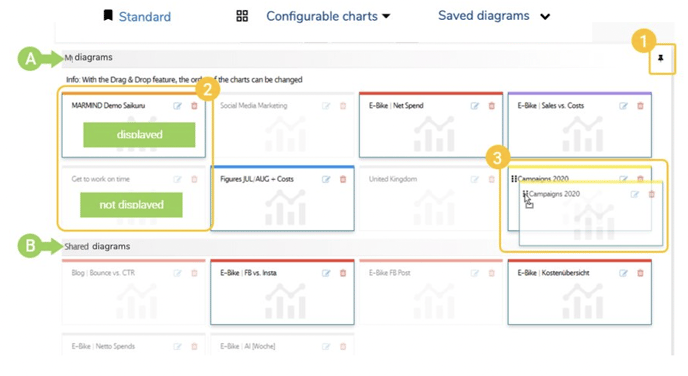
In the “Saved diagrams” menu you can see your own charts (under [A] “My diagrams”) as well as charts from team colleagues (under [B] “Shared diagrams”) who have shared a dashboard bookmark with you. You can pin the menu when you set up your dashboard so that you always have the chart selection at hand (1). Here you can now determine which charts should be displayed on the dashboard. Click on a bookmark tile to show or hide it. Faded tiles are not shown in the charts (2). In the “My diagrams” area, you can also use drag & drop to reposition your bookmark tiles to determine the order in which the charts appear on your dashboard (3).
The following chapter shows how the charts in the dashboard look.