- MARMIND Knowledge Base
- How To
- Dashboard
Show key figure values in the table per graphic
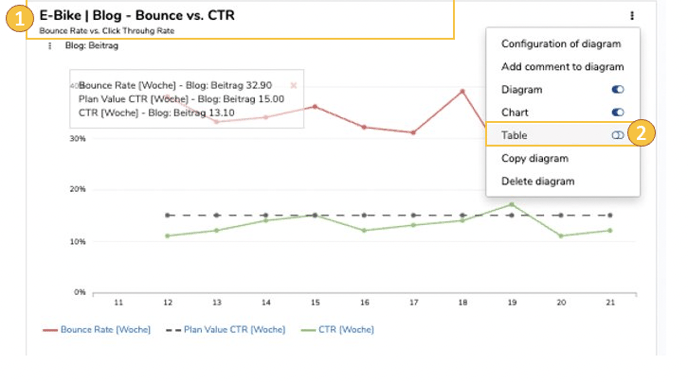
For each chart (1), the dashboard also offers a view of the raw data in a table below the charts if you click on the three vertical dots and check the toggle stating "table" (2).
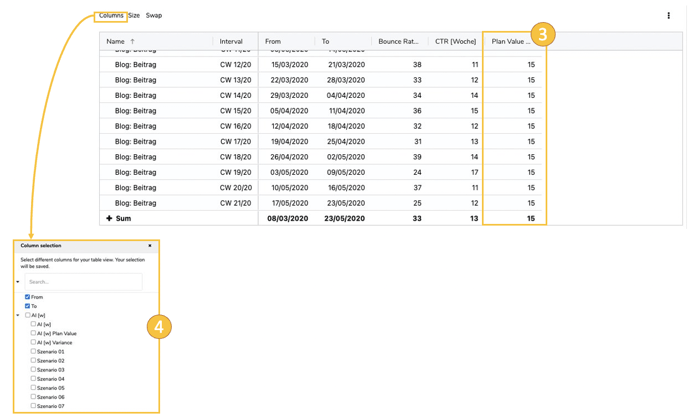
Actual, planned and forecast data can be displayed per key figure and per context (3). Optionally, additional values (4) that are not visualized in the chart can also be displayed in the table when you click on "Columns".