MARMIND® offers you an extensive dashboard for evaluating key figures for your marketing activities. Open the basic chart of the selected context via the main navigation tab "Dashboard" (1).
The dashboard offers you an area for the graphic evaluation (2) as well as a table area (3) for the automatic display of the basic values to your graphics.
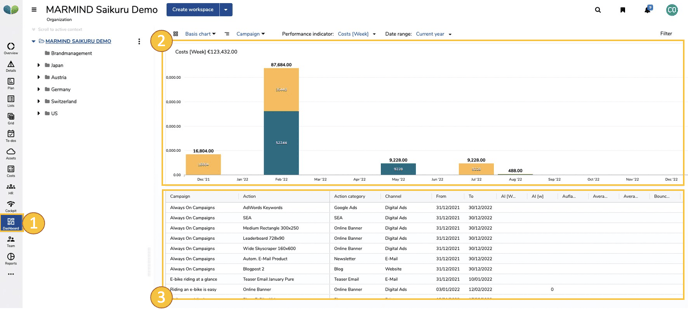
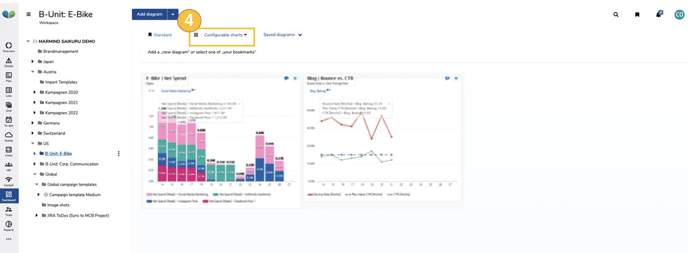
The dashboard essentially offers two types of views (4):
- Basis Chart (picture above): The basis chart shows a selected key figure for your campaigns or actions.
- Configurable charts (picture below): Here you can configure various graphics ("charts") with specially selected key figures and many other setting options, regardless of context.